Campaign metrics are most useful when you review them together.
Start with the Campaigns page for a high-level view, then open a specific campaign for more detail.
Start with the Campaigns page
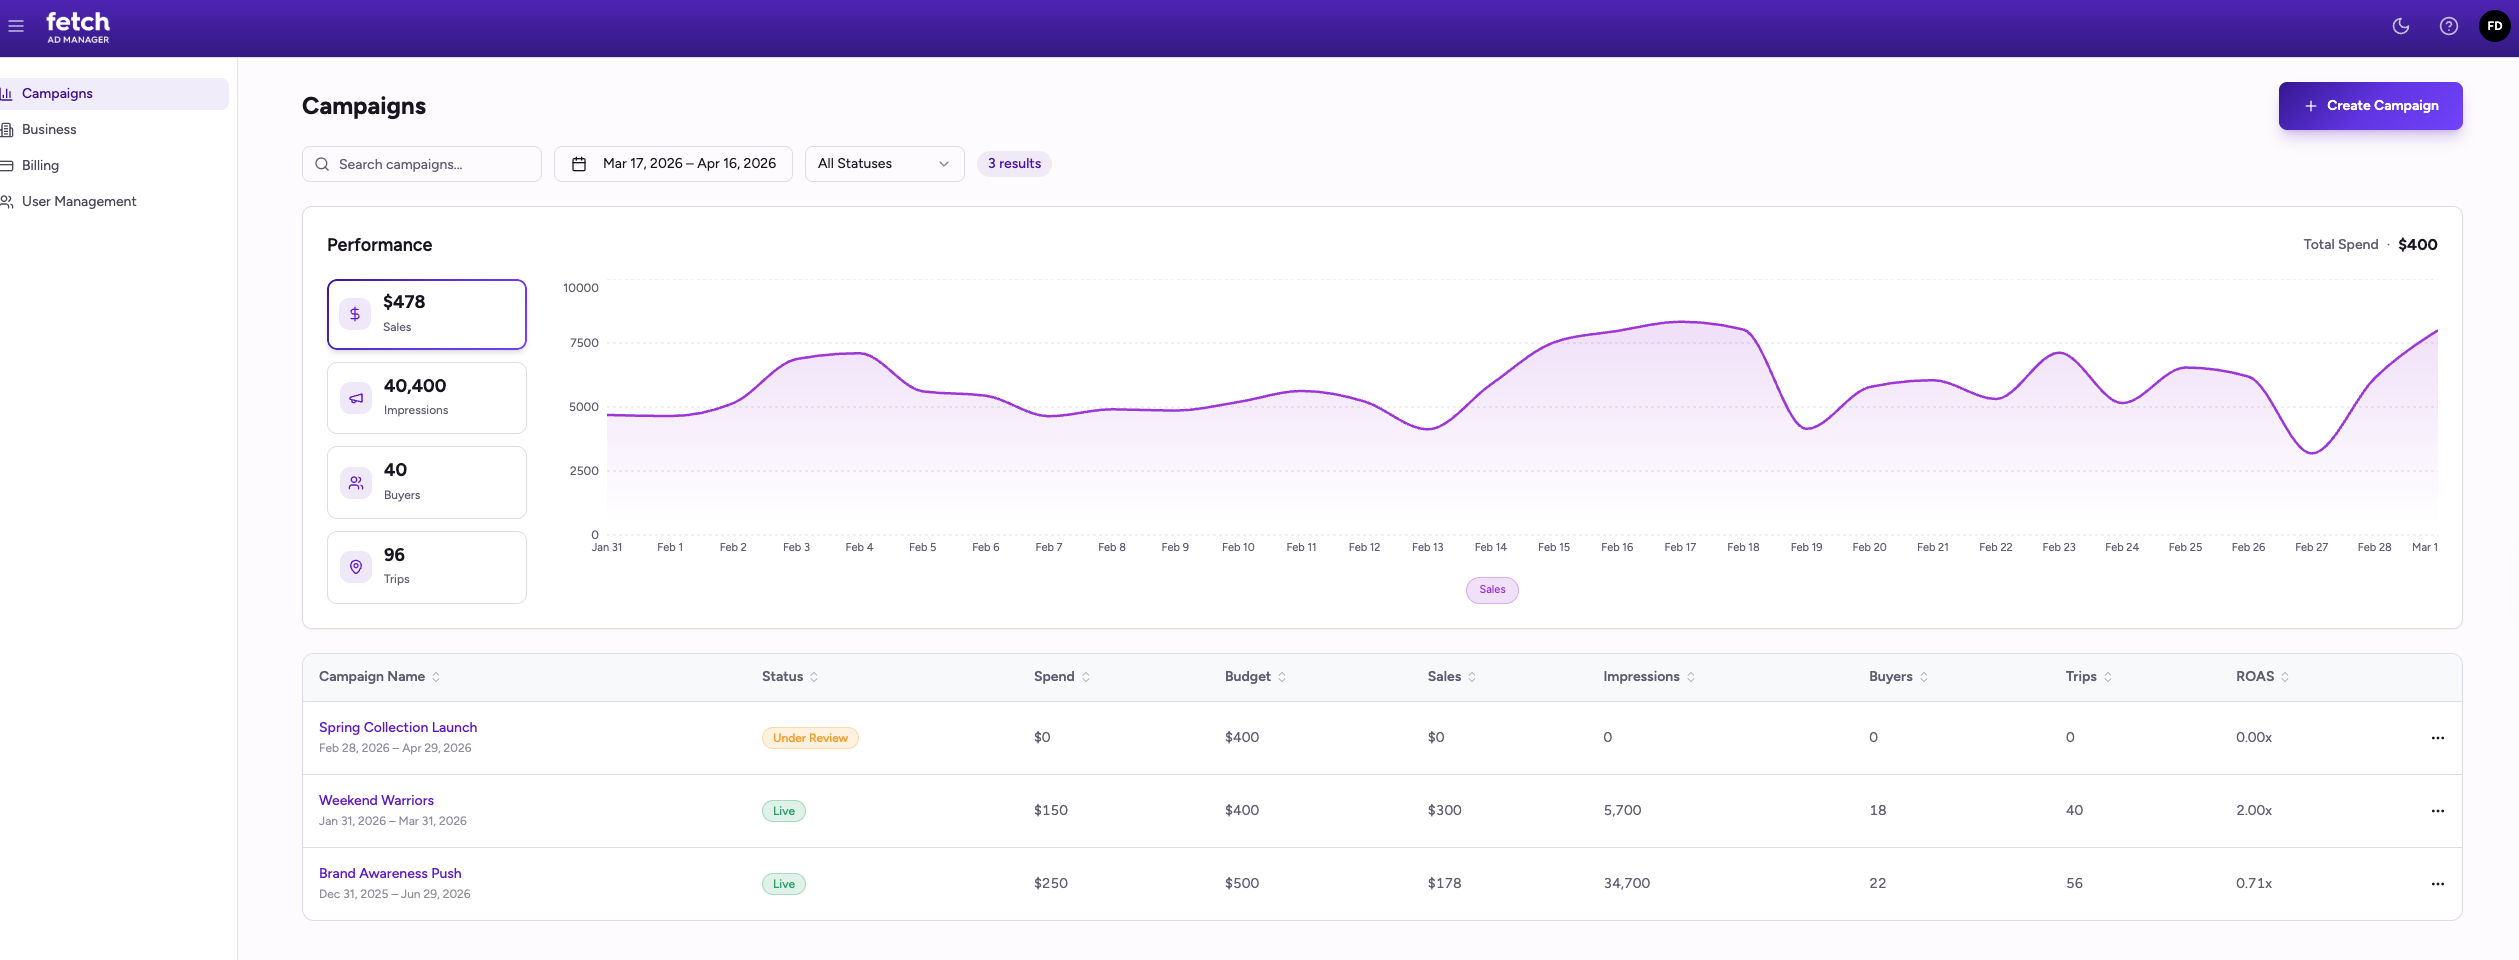
On the Campaigns page, review:
- KPI tiles
- The trend graph
- The campaign table
This helps you quickly understand:
- Which campaigns are active
- Which results are improving over time
- Which campaigns may need closer review
Review the trend graph
Use the KPI tiles to change the metric shown in the trend graph.
A rising trend may indicate improving performance for that metric.
A flat trend may indicate stable performance.
A declining trend may indicate performance is slowing or leveling off.
Compare campaigns in the campaign table
Use the campaign table to compare campaign performance side by side.
Review:
- Status to confirm whether a campaign is live or still under review
- Spend and Budget to understand how much of the budget has been used
- Sales to compare business results across campaigns
Review individual campaign performance
Open a campaign when you want a closer look at its results.
On the campaign details page, review:
- The campaign trend view
- Spend and budget information
- Performance by location
Review performance by location
Use the Performance by Location view to compare results across locations.
Review location-level metrics to understand:
- Which locations are generating the strongest results
- Where spend is concentrated
- Where visibility is strong
- Where results may be weaker than expected
Common performance patterns
High impressions, lower sales
Your campaign is getting visibility, but business results may be lower than expected.
Strong results at some locations only
Some locations may be performing better than others. Review performance by location to compare results.
Low spend and low results
The campaign may still be early in delivery. Review spend before drawing conclusions.
Campaign still under review
A campaign that is not yet live may not show meaningful results.
Best practices
Start broad on the Campaigns page, then drill into an individual campaign for more detail.
Use the trend graph to review changes over time.
Use performance by location to compare results across locations.
Avoid judging performance too early if the campaign has only spent a small portion of its budget.